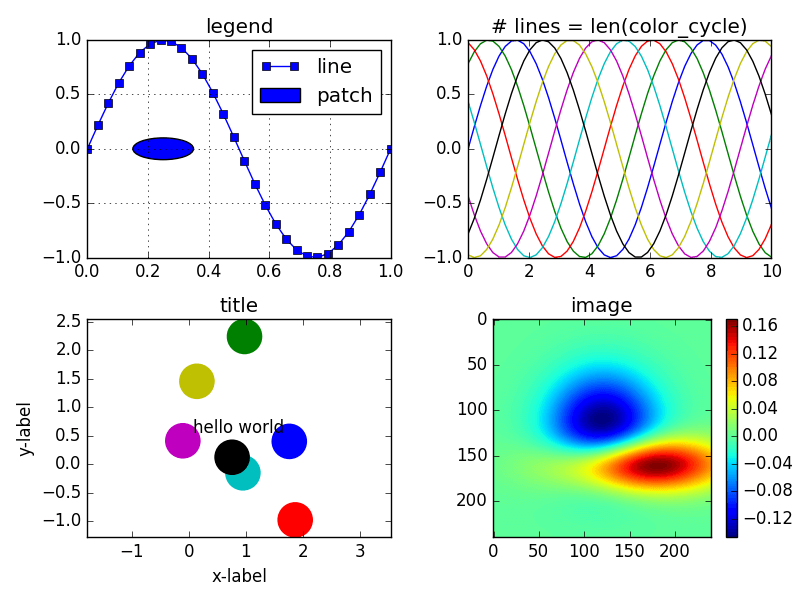
用matplotlib绘制统计图表

matplotlib 是一个用于 统计绘图Python 包,功能非常强大,堪比 Matlab !开始前,先通过几张图来感受一下:

快速开始

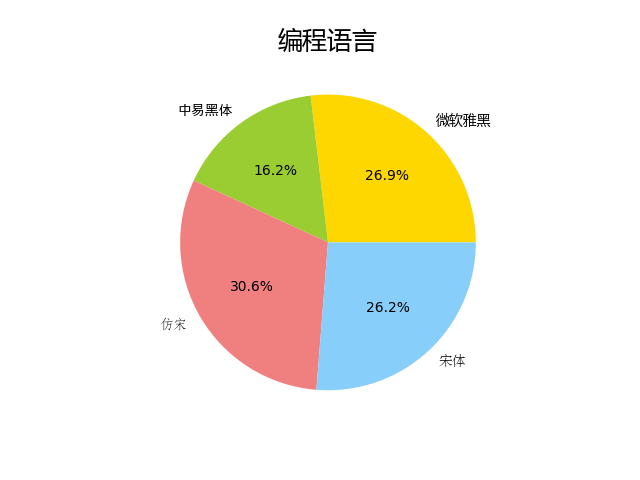
饼状图应该是最简单的统计图表了,用以介绍 matplotlib 画图方式最为合适。 数据准备就绪,生成饼状图只需若干行代码:

 1
 2
 3
 4
 5
 6
 7
 8
 9
10
11
12
13
14
15
16
17
18
import matplotlib.pyplot as plt

# data to plot
labels = ('Python', 'C++', 'Ruby', 'Java',)
sizes = (215, 130, 245, 210,)

colors = ('gold', 'yellowgreen', 'lightcoral', 'lightskyblue',)

plt.pie(
    sizes,
    labels=labels,
    colors=colors,
    autopct='%1.1f%%',
)

plt.title("Programming Languages")

plt.show()

4-5 行,为待渲染数据,包括 数值 以及 标签 ; 第 7 行,定义渲染 颜色 ; 第 9-14 行,配置饼图,包括数值、标签、颜色以及百分比展示; 第 16 行,为图表追加 标题 ; 第 18 行,将图表展示出来。

运行程序后,画出的图表效果如下:

字体

在编程世界,中文一直是个麻烦事。 不折腾一番, matplotlib 是不能渲染中文文本的。

matplotlib 支持中文 的方式有不少,接下来介绍一种最简单的: 准备好字体文件,为文本定义 FontProperties 并设置。 除了指定 字体FontProperties 还支持 字号粗细斜体下划线 等属性设置。

 1
 2
 3
 4
 5
 6
 7
 8
 9
10
11
12
13
14
15
16
17
18
19
20
21
22
23
24
25
26
27
28
29
30
31
32
33
34
35
36
37
38
import matplotlib.pyplot as plt
import matplotlib.font_manager as mfm

fonts = (
    ('微软雅黑', 'Downloads/Microsoft Yahei.ttf',),
    ('中易黑体', 'Downloads/SimHei.ttf',),
    ('仿宋', 'Downloads/FangSong.ttf',),
    ('宋体', 'Downloads/STSong.ttf',),
)

# load font files
label_fonts = tuple(
    mfm.FontProperties(fname=path, size=10)
    for _, path in fonts
)

title_fonts = label_fonts[0].copy()
title_fonts.set_size(18)

# data to plot
labels = [name for name, _ in fonts]
sizes = (215, 130, 245, 210,)

colors = ('gold', 'yellowgreen', 'lightcoral', 'lightskyblue',)

patches, texts, autotexts = plt.pie(
    sizes,
    labels=labels,
    colors=colors,
    autopct='%1.1f%%',
)

for text, font in zip(texts, label_fonts):
    text.set_fontproperties(font)

plt.title("编程语言", fontproperties=title_fonts)

plt.show()

程序第 11-15 行加载字体文件,并设置字号; 第 17-18 行在第一个标签字体基础上设置新字号,作为标题字体, 第 33-34 行为 4 个标签分别设置字体; 第 36 行指定标题,同时设置标题字体。

运行程序后,画出的图表效果如下:

Github 上有个项目提供一些字体文件,以供测试: dolbydu/font

保存图片

将图表保存成文件,只需调用 savefig 方法。保存为 PNG 图片:

1
plt.savefig('foo.png')

文件格式由文件后缀名决定,另存为 PDF 文件:

1
plt.savefig('foo.pdf')

如果仅需获取保存文件内容,则可借助 BytesIO :

1
2
3
4
5
6
7
import io

bio = io.BytesIO()
plt.savefig(bio, format='png')

bio.seek(0)
content = bio.read()

附录

  1. 我遇到的疑难杂症和解决方法

【小菜学Python】系列文章首发于公众号【小菜学编程】,敬请关注:

【小菜学Python】系列文章首发于公众号【小菜学编程】,敬请关注: